Original Scientific Paper
Map Projections and Sustainability
https://doi.org/10.32909/kg.23.41.3
Abstract
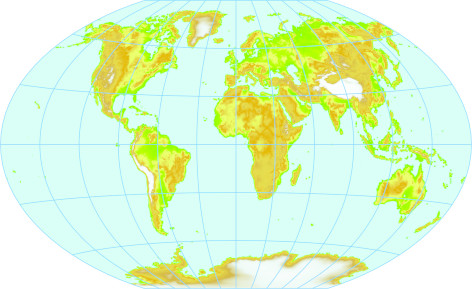
The United Nations called on the international community to move forward together. Through the Sustainable Development Goals (SDG), a plan was set until 2030. The use of maps, mapping technology and the skills of cartographers help synthesize and visualize complex data. Maps allow insights into trends and comparisons between different areas and over different time periods. Mapping helps in better understanding and implications of each sustainable development goal. For this purpose, the paper presents map projections with a special emphasis on mapping for a sustainable world. Map projection is not only the transformation of geospatial data, but of any data related to space. Presented is a modern classification of map projections that differs from the usual division into cylindrical, conical and azimuthal. For maps of the world adapted to the goals of sustainable development, the Winkel Triple projection is proposed. Different map projections bring with them significantly different distortions. The energy consumption for displaying a digital map varies greatly when using different projections. This is the area of a new branch of cartography − green cartography. In the article, we take a critical look at the research of digital maps and their carbon footprint and warn against maps made in map projections that should not be researched in the future. The article is intended for everyone who is interested in cartography as an auxiliary profession in sustainable development, but also for cartographers who do not think critically enough about map projections.
Keywords
map projections; sustainability; green cartography
DOI: http://dx.doi.org/10.32909/kg.23.41.3
Copyright (c) 2024 Miljenko Lapaine, Nedjeljko Frančula, Marina Viličić

This work is licensed under a Creative Commons Attribution-ShareAlike 4.0 International License.

